
Occurrence of a communicable disease outbreak is function of three things – presence of causal factor (organism), environment (favourable conditions) and carrier (humans/others). The population at the place where all these factors come together gets affected by disease. Here below we discuss aspects that are critical to manage a pandemic and the role geospatial technology plays in understanding the pandemic and develop solutions. Importantly we identify opportunities for furthering education and research in liberal education context to pursue.
What aspects are critical to manage in any epidemic or pandemic episode?
According to the World Health Organization (WHO) report titled “Managing Epidemics: Key facts about major deadly diseases”, even in the 21st century, population of all the continents are susceptible to known and unknown infectious diseases. The report claimed that whenever we felt we have defeated the known microbes and shifted our focus on non-communicable diseases; the nature found new ways to get us. Ebola, HIV and similar other deadly communicable diseases would keep coming back. Plague in Madagascar (2017), SARS (around 2003), the novel influenza virus (H1N1) (2009) and Zika virus (2015) have been witnessed in 21st century.
For any infectious disease, one has to know the transfer mechanism of the causal microorganism. Besides its transfer mechanism, the availability of agents, and geographic distribution of supporting conditions determines the extent of spread of diseases. Now comes the novel Corona virus which did not limit itself at the location of its assumed origin, i.e. Wuhan, China but it went across the globe to cause pandemic. There is a heavy role of geographies in the spread of COVID-19. Even though it may have been transferred from animals to human beings, the spread among human beings is happening through direct contact with infected people. The daily activities which brings human in contact with each other – office commute, office environment, shopping, visiting healthcare facilities, social gatherings, religious gatherings and travel (national and international) – all contribute to these geographies because it happens at a particular place or through a space-time manner. In the lieu of no vaccine for the current Corona virus, to contain the disease is possible via eliminating these geographies, i.e. stay in one place and avoid contact.
How can geospatial technology be useful?
- Data visualization
Location based visualization of data using geospatial technology helps in various ways. For a viewer, it conveys the complex information in one go, which would be difficult to fathom otherwise. For example, one must have witnessed use of maps in the news and lots of dashboards created at country and world level to display information of COVID-19 cases. A dashboard developed by Johns Hopkins University along with ESRI provides global tracking of the cases: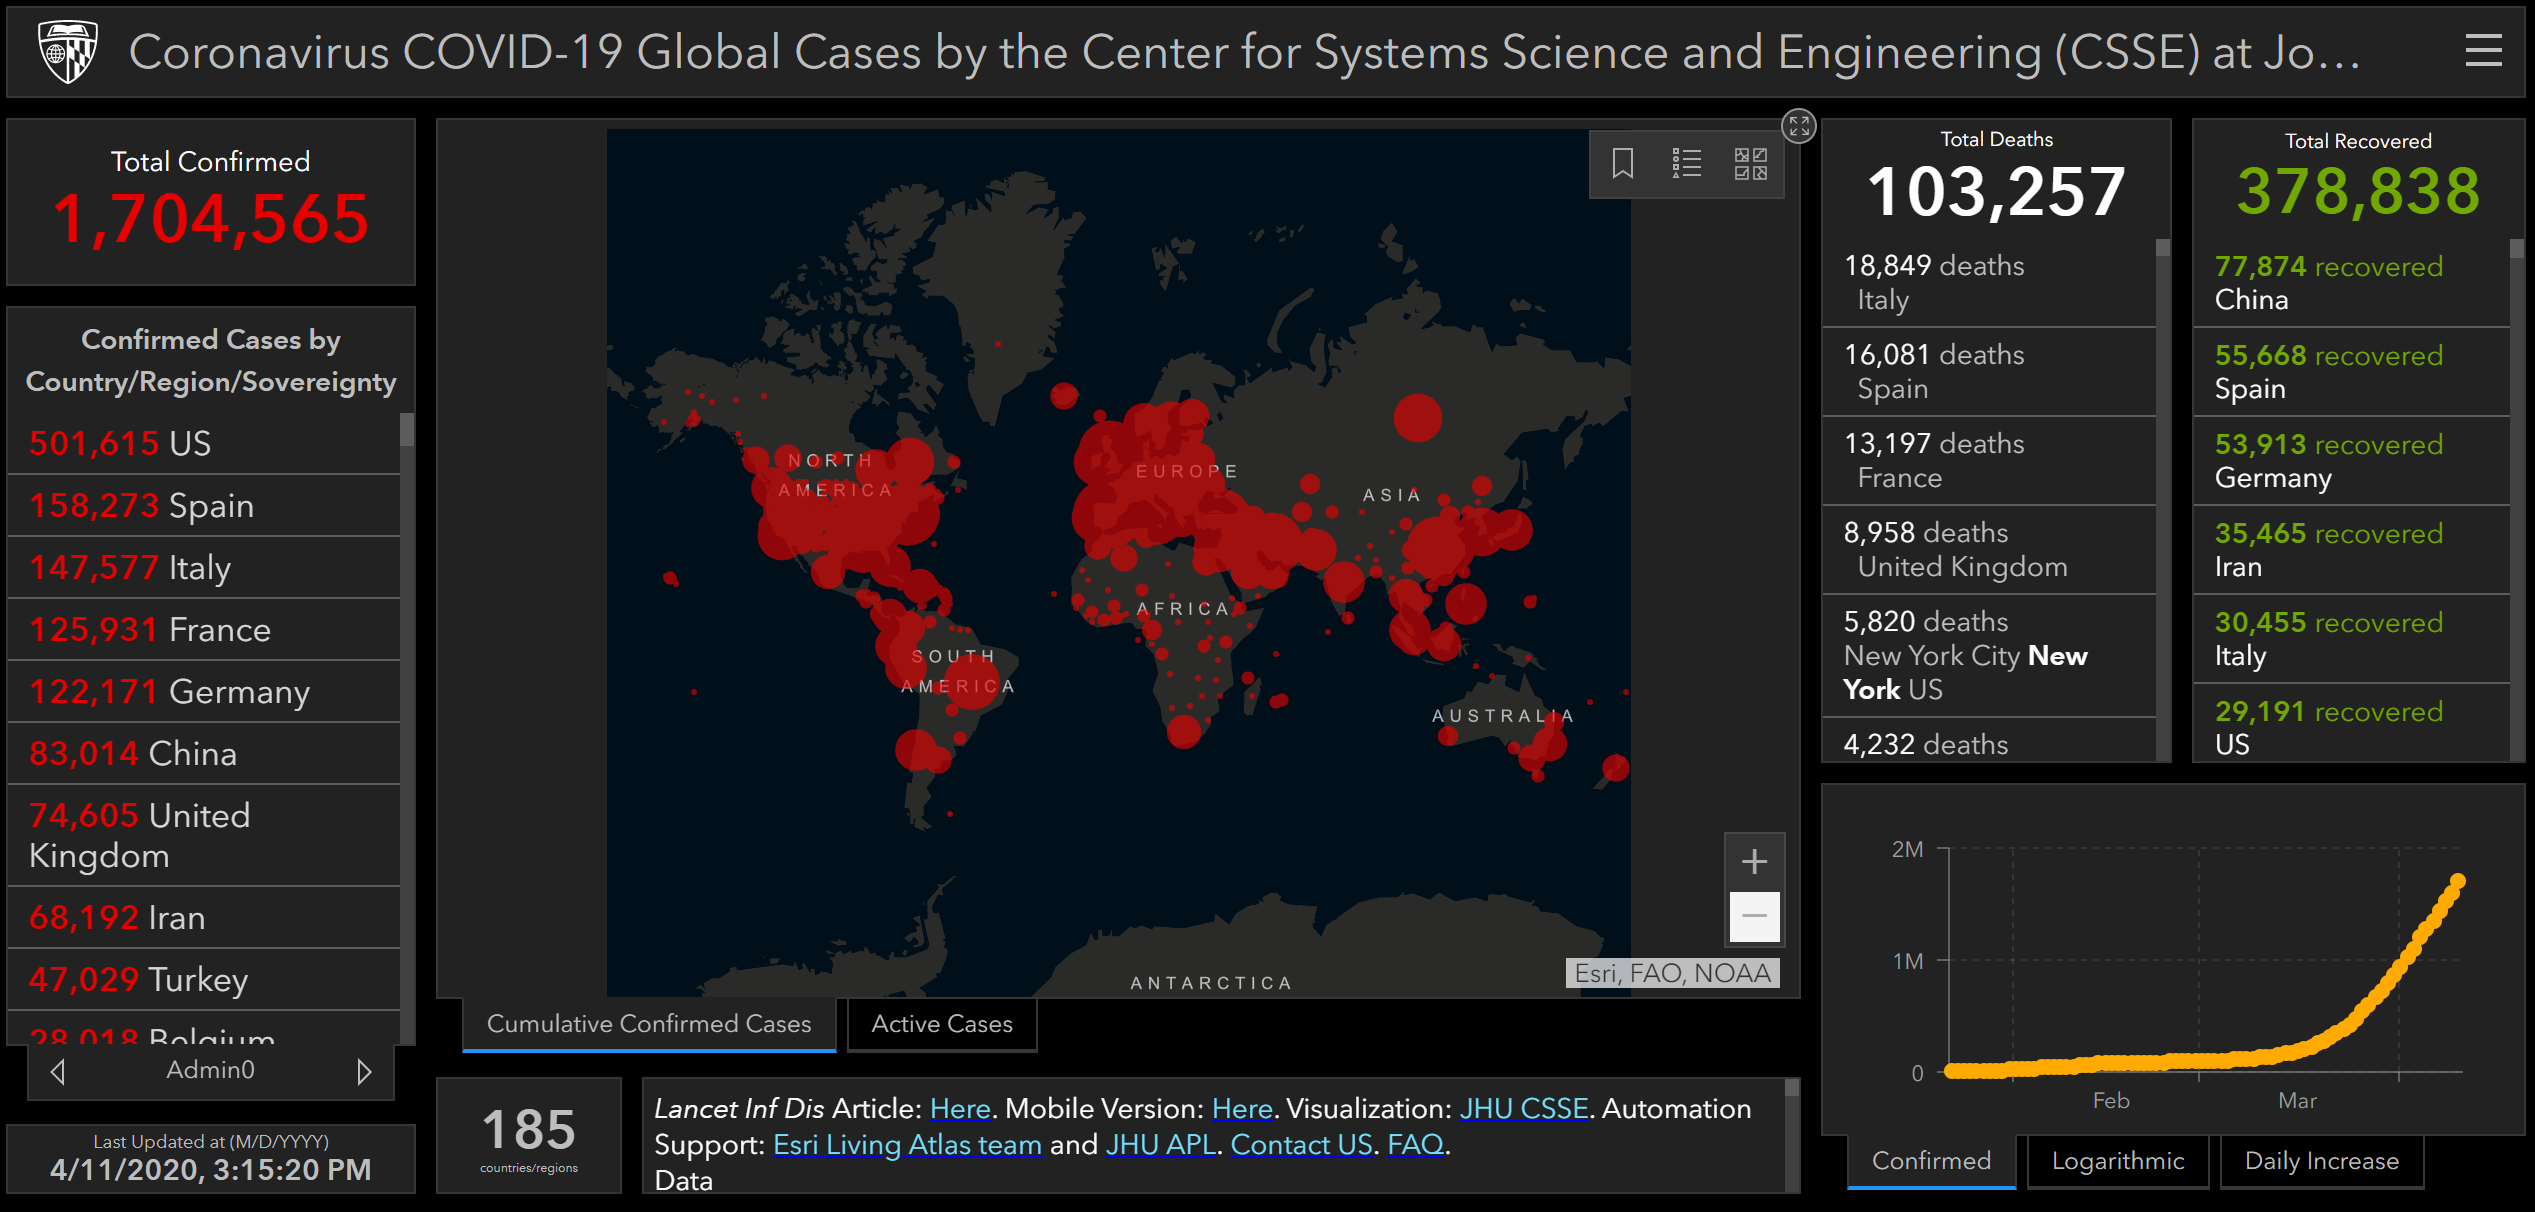
Source: https://www.arcgis.com/apps/opsdashboard/index.html#/bda7594740fd40299423467b48e9ecf6
In India, we have a national dashboard provided by National Disaster Management Authoriy, Government of India.
Source: https://gis.ndma.gov.in/arcgis/apps/sites/#/data
Each one of them may have a common goal to inform people about the current scenario at different scale. The global dashboard provides cumulative scenario at country level. A very stark pattern of high number of cases occur over specific belt from China to India to Middle East to Europe. Number of cases in Africa appear to be much lower. Contrary to that United States has affected severely as per the display. The dashboard reflects real time number of cases but being run by a US-based agency, it has more details about the USA than other countries.
On the other hand, India’s dashboard provides detailed information about total cases at State level along with Hospital locations where Corona testing is available, Quarantine facilities and Rahat camps. As normal citizens, it may tell us the nearest hospital for testing or a nearest Quarantine facility for patients. It is also showing clearly that only 10 or 11 states have Rahat camps and more testing facilities. Some of the eastern states like Chhattisgarh, Jharkhand and north-east states don’t have many of these facilities. This is useful for decision makers to understand not only the spatial spread of the disease but also the facilities available in managing the outbreak. For example, health ministry can use this data and check the states or urban clusters which are more affected and compare the relevant facilities available at those locations or they can mobilize them relatively. Thus, visualization of geospatial information serves a big role in this disaster management.
- Temporal analysis
This temporal progression of the COVID-19 in India shows that initially it was only Kerala where it was detected but later in the month of March, many more states witnessed its presence. As of now, Maharashtra remains the highest affected state. It is interesting to see that the eastern states and north-east remain well below other states. It may be indicative of the low frequency of testing or really low number of cases.
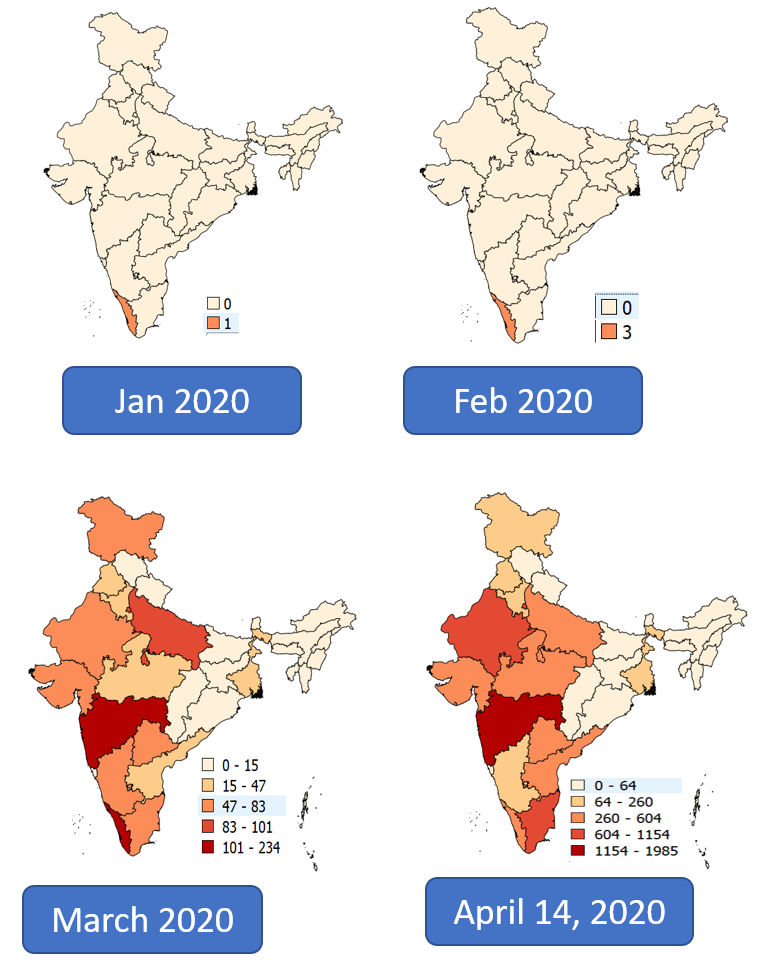
Source of the data: https://www.kaggle.com/sudalairajkumar/covid19-in-india
- Disease modelling
Geospatial information is critical in disease modelling where one wants to predict spread of the disease, its impacts (rise or fall in the cases) and containment. For example, for the current Corona infection, Singh and Adhikri (March 2020) carried out (Susceptible- Infected-Recovered) SIR modelling. They used “age-structured SIR model with social contact matrices” to explain that nature of the spread of the disease in India as compared to China and Italy. They predicted that the 21 days of lockdown would not be enough to control the disease spread but 49 days would show significant results. The study highlighted that the social structure of each country might be different and hence, the contact between different generations and the spread and morbidity will be different. China and Italy show more old population and their contacts remain mostly within similar age groups. The map below presents distribution of joint families (7 plus family members) who are at least three-generation households thus, strategies in India to contain the disease must be different. The strategy needs to consider geographic variation of the demography and its implications in spread and control of COVID-19.
India’s Joint family (7 plus members) distribution (Rural and Urban)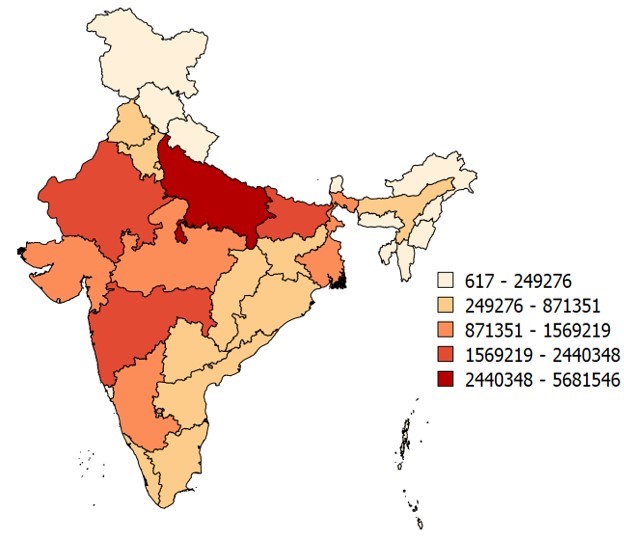
-New methods of data collection
Traditionally geospatial data required a lot field work and collection of data from analogue files in various offices. Now, however, India has moved towards open data sharing and lots of municipal, regional and national geospatial data is available through government portals for citizens and scientific communities. One such example is BHUVAN portal (https://bhuvan.nrsc.gov.in/bhuvan_links.php) where various kinds of value added products are available for visualization and some for download. For COVID-19, the Health Ministry has been releasing data which is being utilized by various volunteers, researchers and decision makers by converting it into spatial information.
There has been heavy use of extracting regional and local information from the internet based apps like Facebook, Tweeter and online Newspapers reporting about COVID-19 in India. These data sources not only provide you very concurrent and geotagged information. It has been highly effective way of collecting data. The caveat is that the one has to make sure the authenticity of the information before sharing. Therefore, these online sources have been treated as double edged swords.
Talking about new ways of data sharing and communication, Government of India has come with AROGYA SETU app for smartphone users. This app allows users to check his/her own symptoms for COVID-19 and if required the user can directly contact nearby health authority. Also, based on Bluetooth technology and location service, the app user can get notifications about potential COVID-19 patients in their locality. This is proving to be an example of geo-fencing. On one hand, it shows the readiness of the government to use latest technology to reach out to people and provide support; it ignores that there might be many telephone users who do not have smartphones. Or if they have it, they may not be literate enough to use the apps or even understand importance of the government instructions about it. Therefore, to use technology, there has to be mass education mechanism enabling them to cross that bridge.
How can anyone contribute? Citizen participation for geospatial information
Again, AROGYA SETU is an excellent citizen participation app where each one of us can provide information about ourselves and the government can then understand increase or decrease in number of affected people in various regions. Besides that, if you are geospatial technology user, you can volunteer with local government for mapping and decision making process. Academic instituets with technical resources can definitely help with the process. One of the excellent examples of it is the dashboard developed by Mahindra Ecole Centrale’s students and professors for the Government of India. The group goes through different data sources such as ministry websites, local newspapers, etc. and compiles district level data for India.
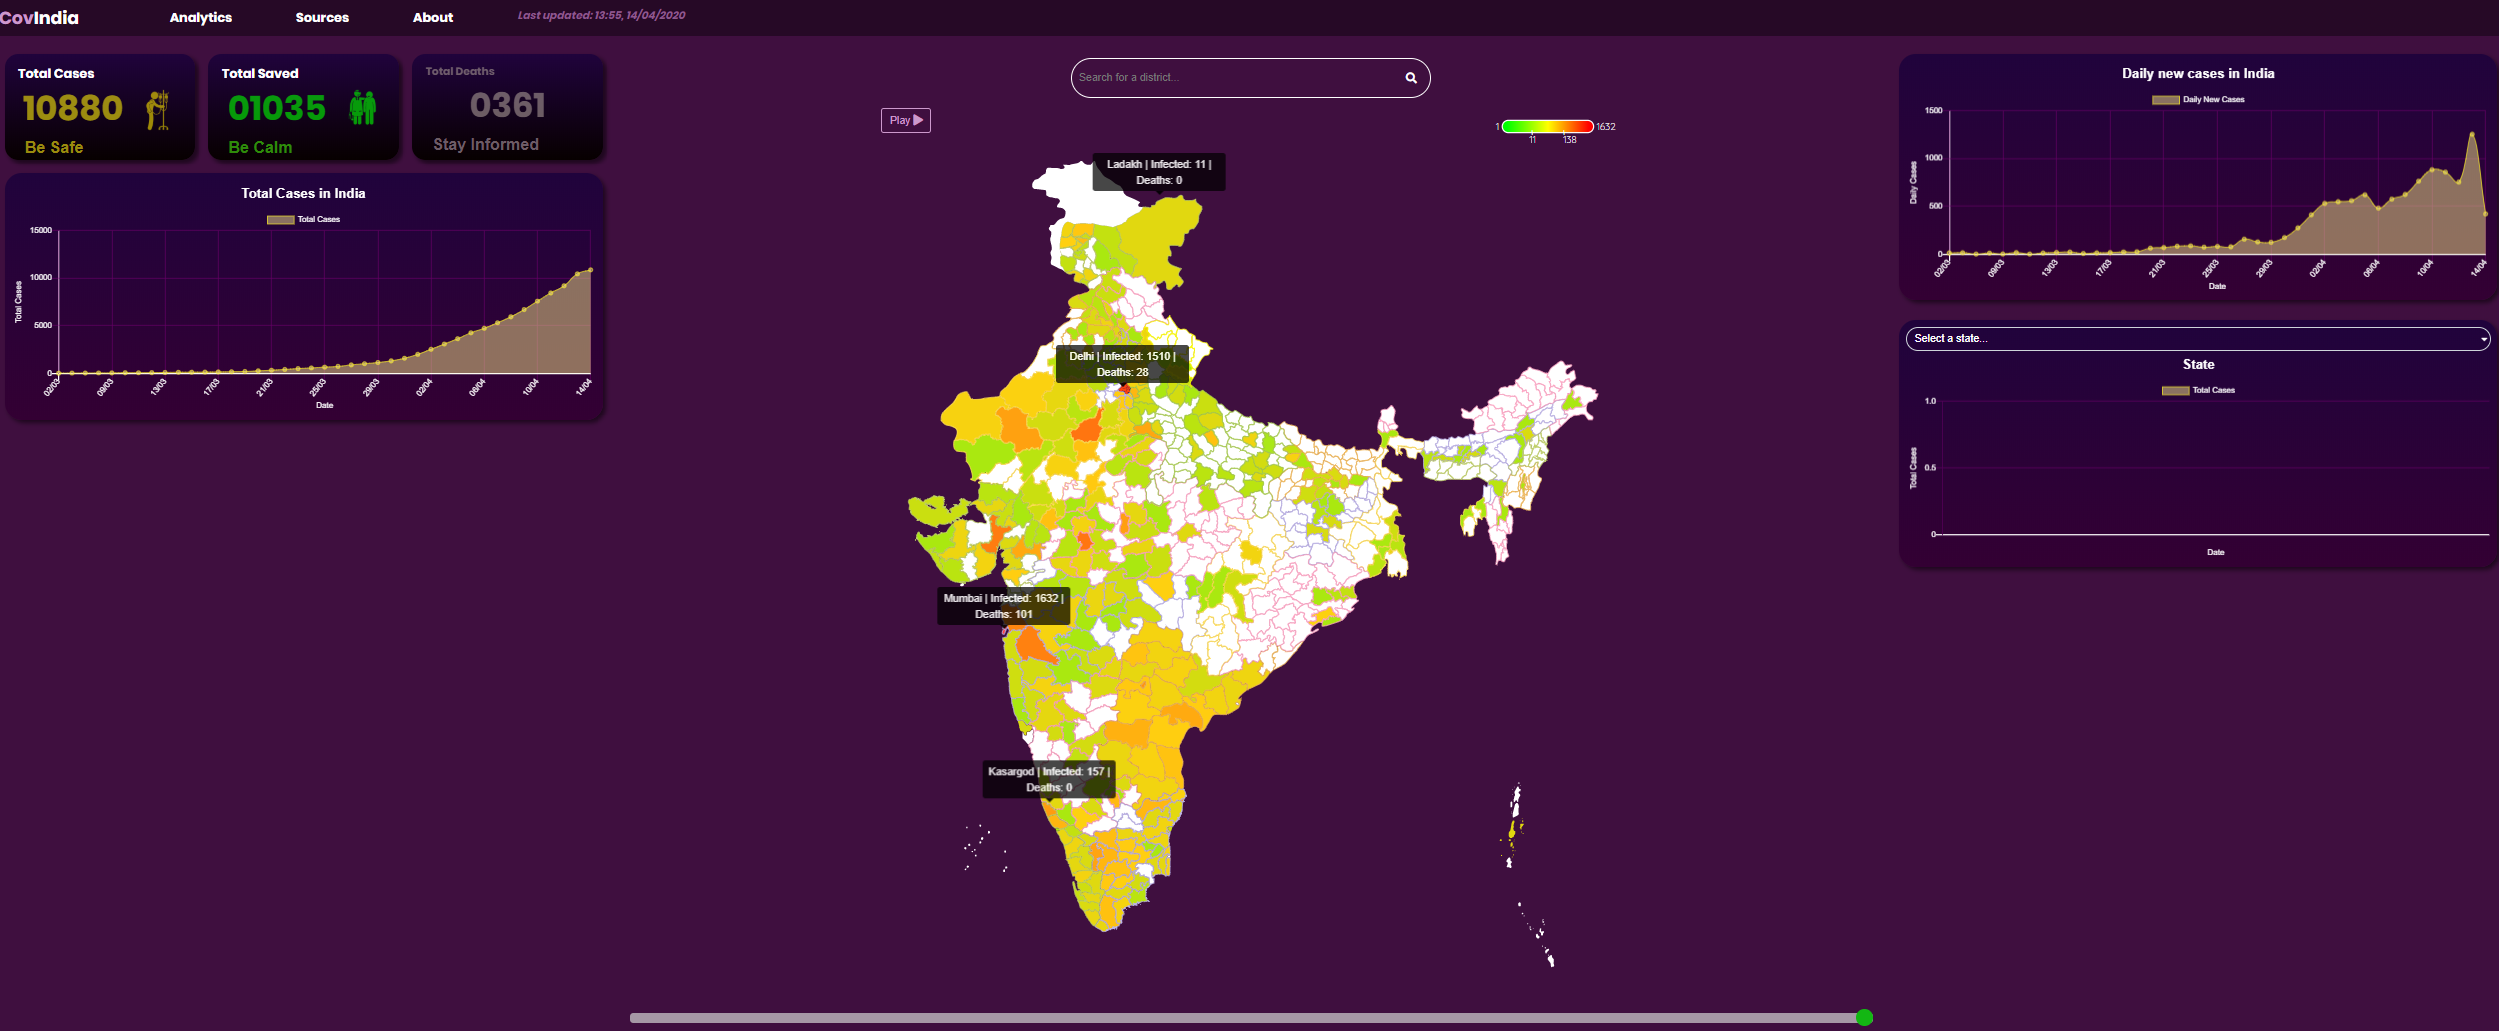
Source: https://covindia.com/
The data giants like Google Inc. have also come forward in aiding the affected communities. Google has made information about the testing labs, shelter homes, food providing places and other relevant information searchable. Google is also keeping track of traffic movement which they are currently reporting to be very low everywhere. This can become a tool for movement surveillance as well.
Now with the extended lockdown in place if we take a look at the distribution of road and rail network over hotspot districts, it illustrates to the policy makers how intertwined the geography of COVID-19 is to making decisions on exit strategy.
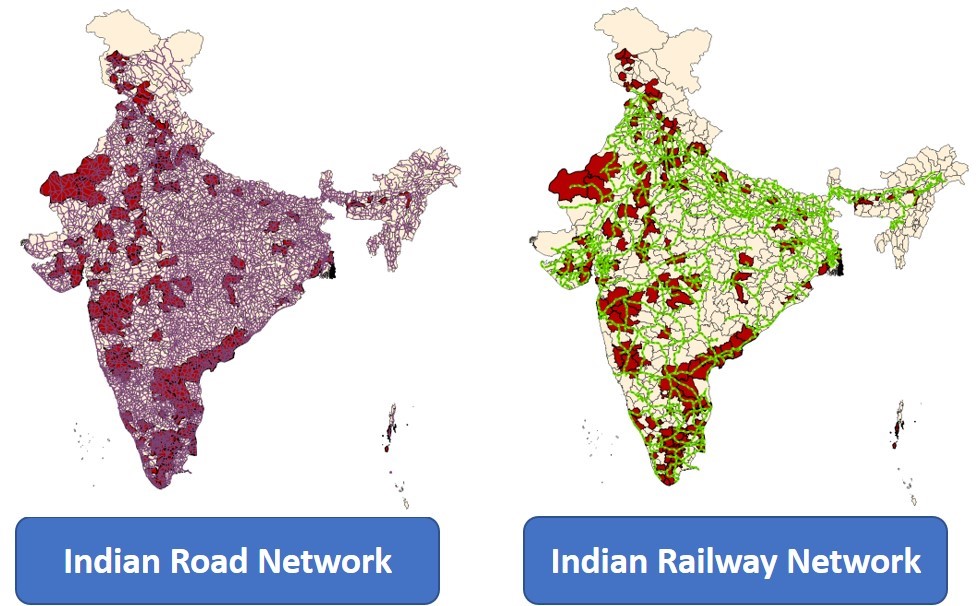
Note: Out of 170 districts, only 143 have been displayed here as the GIS data available for district boundary is updated up to 2011 census and hence the new districts or districts with name changes are not included.
Conclusion:
Academic and research settings are making significant contributions during this pandemic as illustrated by some of the above GIS outputs. There are plenty more opportunities for academic and research settings and they include potential new curriculum in One Health, Evidence Based Practice for Health, Social Care and Education, Digital Literacy with an emphasis on Geographical Information Systems and Othering in Public Policies.
One Health is an approach that recognizes that the health of people is closely connected to the health of animals and our shared environment. Curriculum designed and co-taught by experts in human, animal, environmental health, and other relevant disciplines including monitoring and controlling public health threats based on evidence and to learn about how diseases spread among people, animals, plants, and the environment based on understanding and applying principles of GIS is a way forward in preparing citizens for the future. Furthermore, it becomes an imperative to pave the foundations to understand the policy making processes that view and label people who are different in a way that devalues them and is exclusionary in nature that creates a missing link in One Health where health is a state of complete physical, mental and social well-being and not merely the absence of disease or infirmity.
- Prof. Prasad Pathak, Associate Professor – Environmental Studies
- Prof. Hasheem Mannan, Professor – Public Policy
Note: The maps of India in this article do not show separate Ladakh. Wherever, the data is available, it has been merged with Jammu and Kasmir.